PT Japfa Comfeed Indonesia Tbk's management explains the business in its own materials. The slides below do the most of that work, pulled from the documents preserved in Sources. Each source link opens the complete presentation at that slide in a new tab.
Management's current overview: what Japfa does across the poultry value chain, how segments earn, market position and latest financials. · Open the full document →
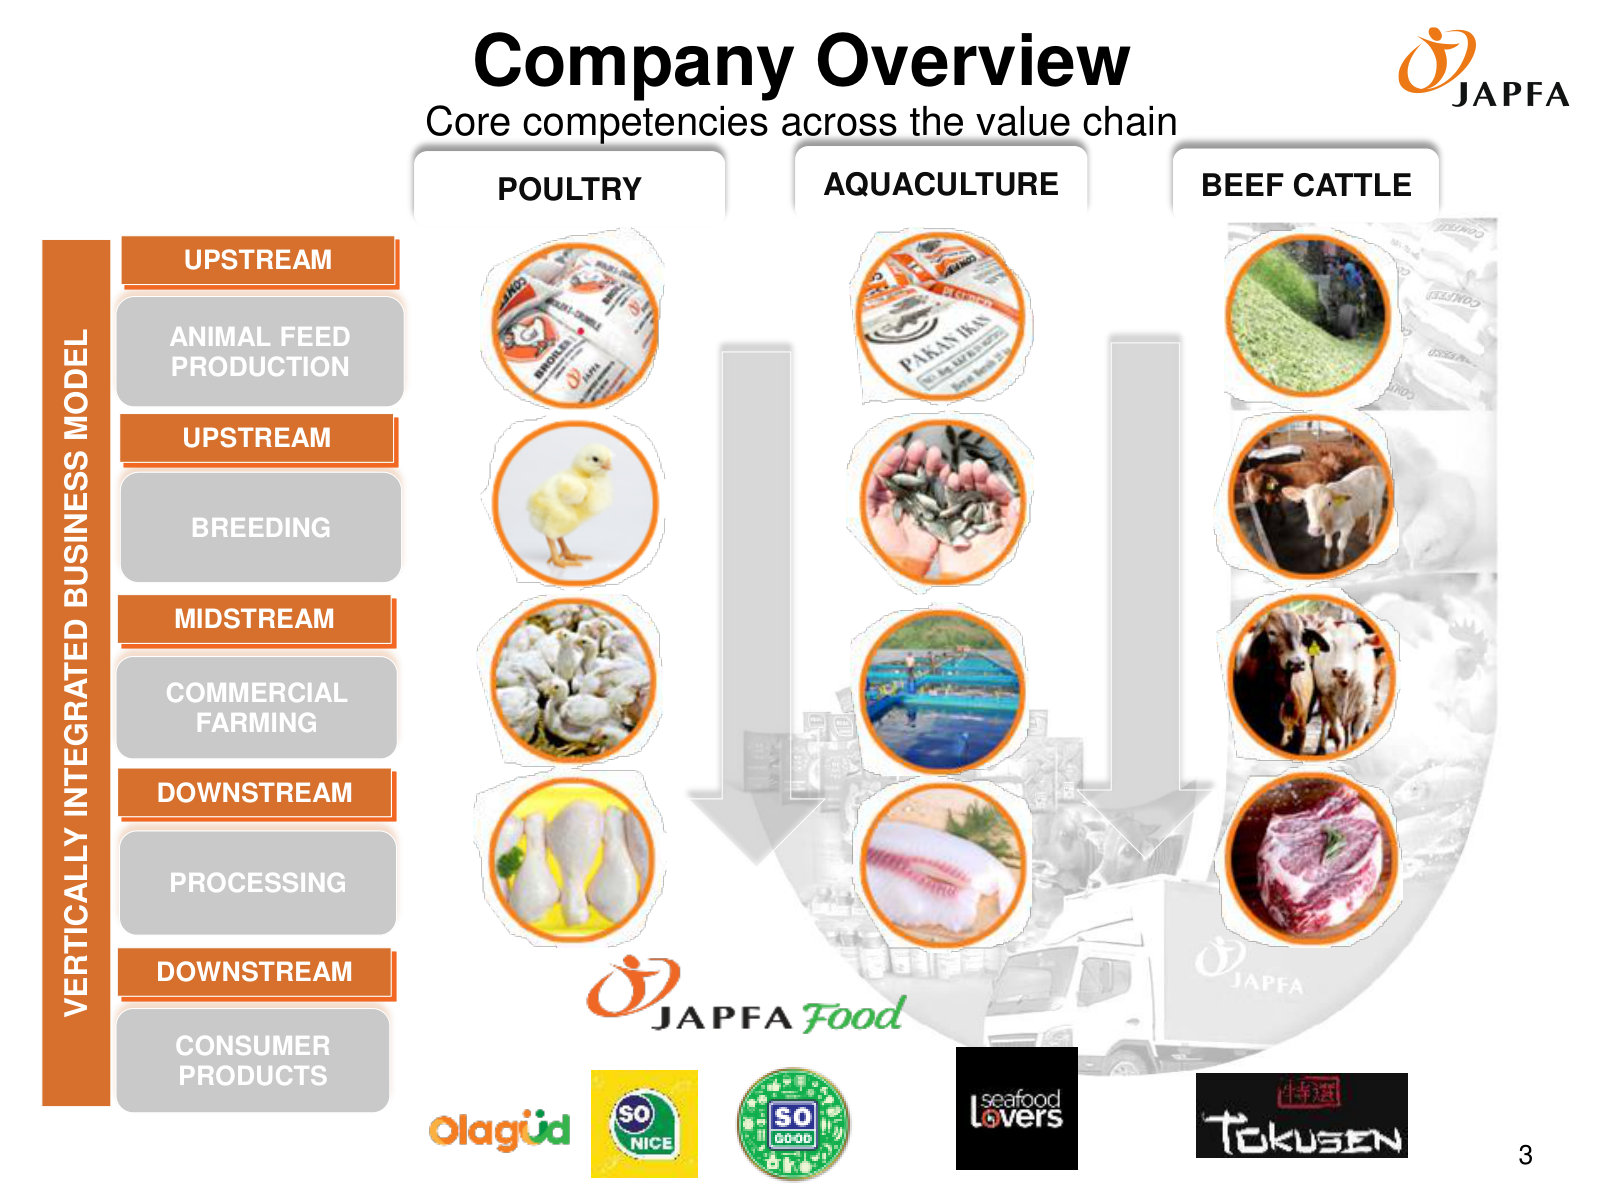
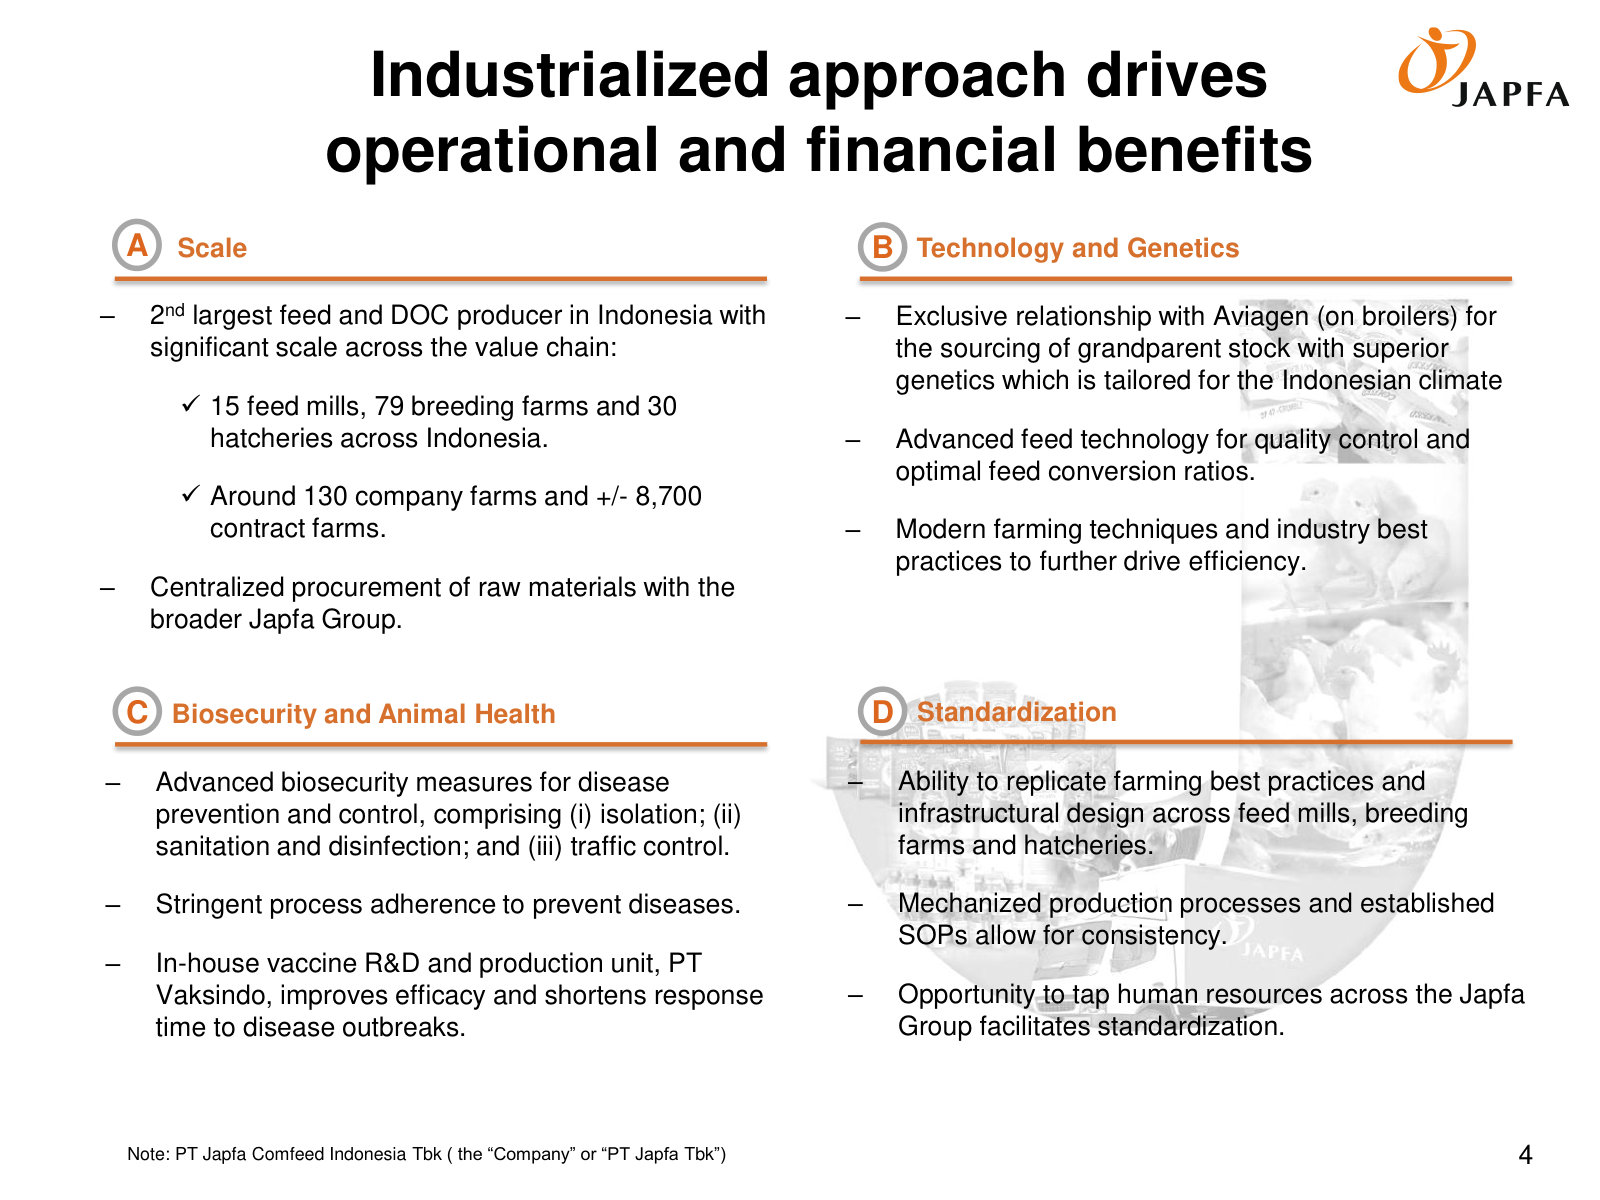
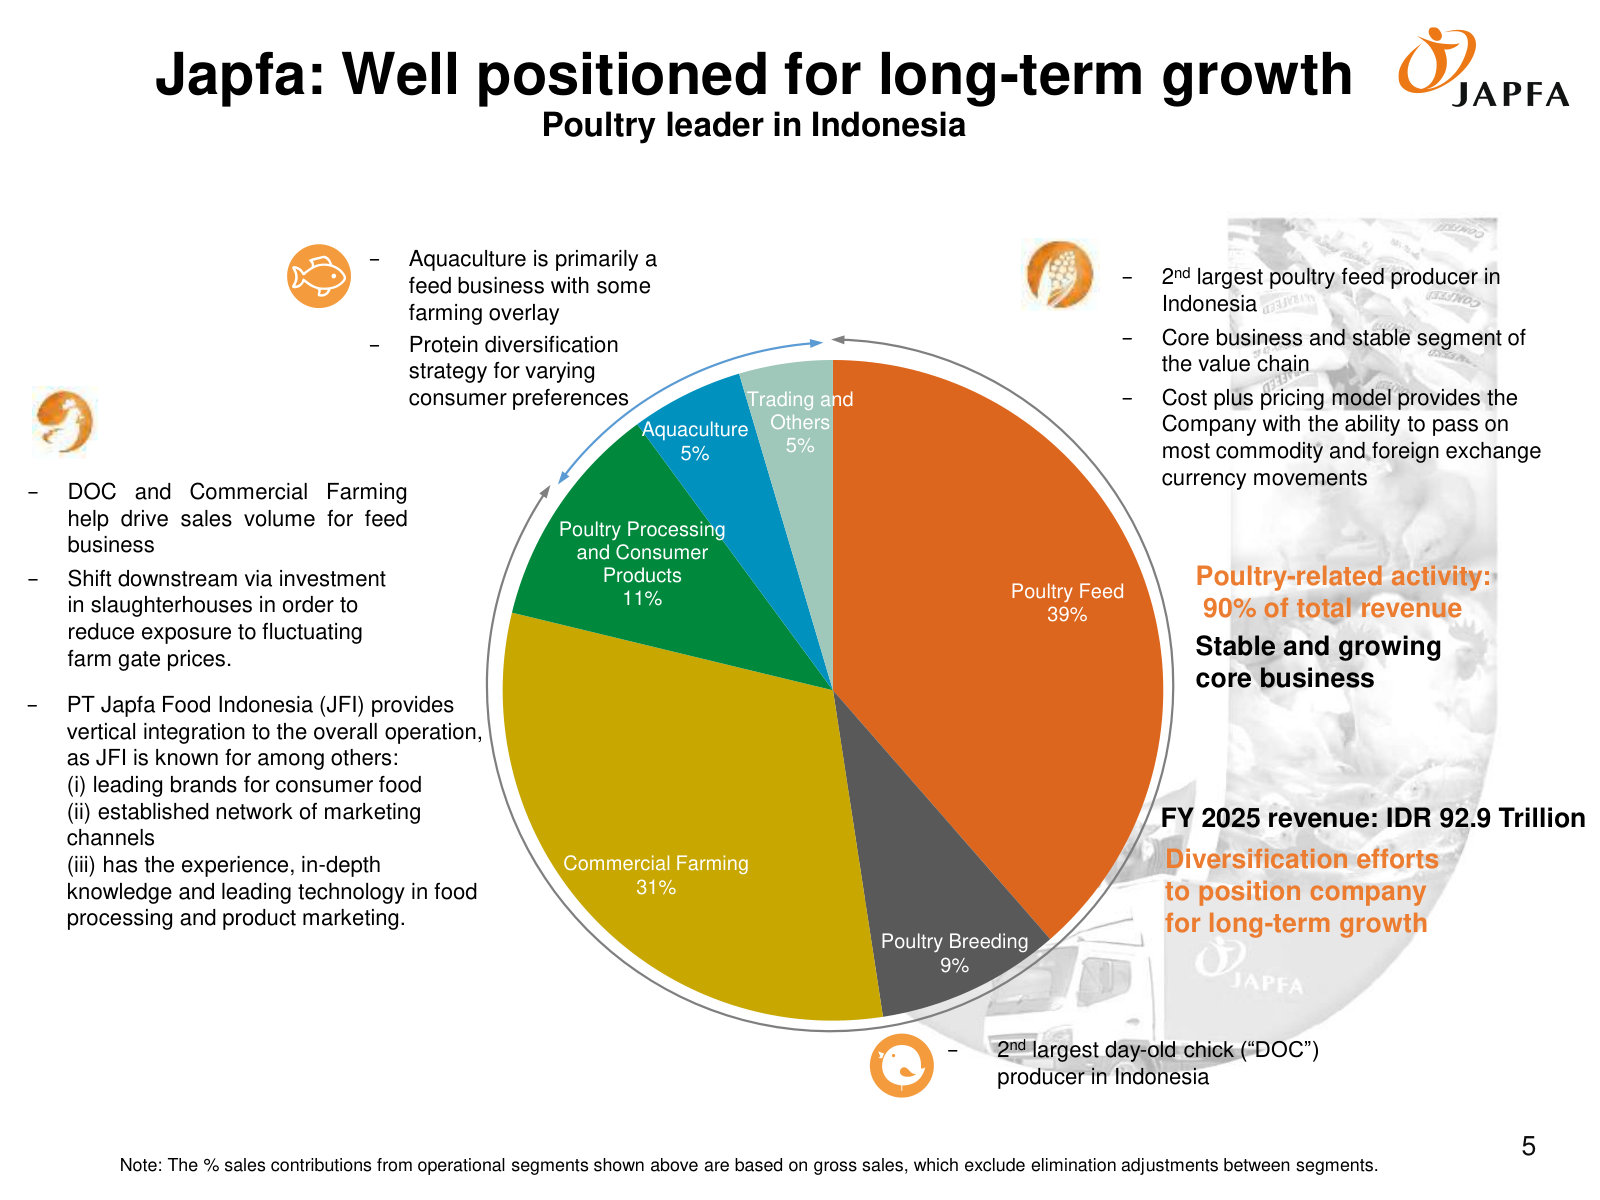
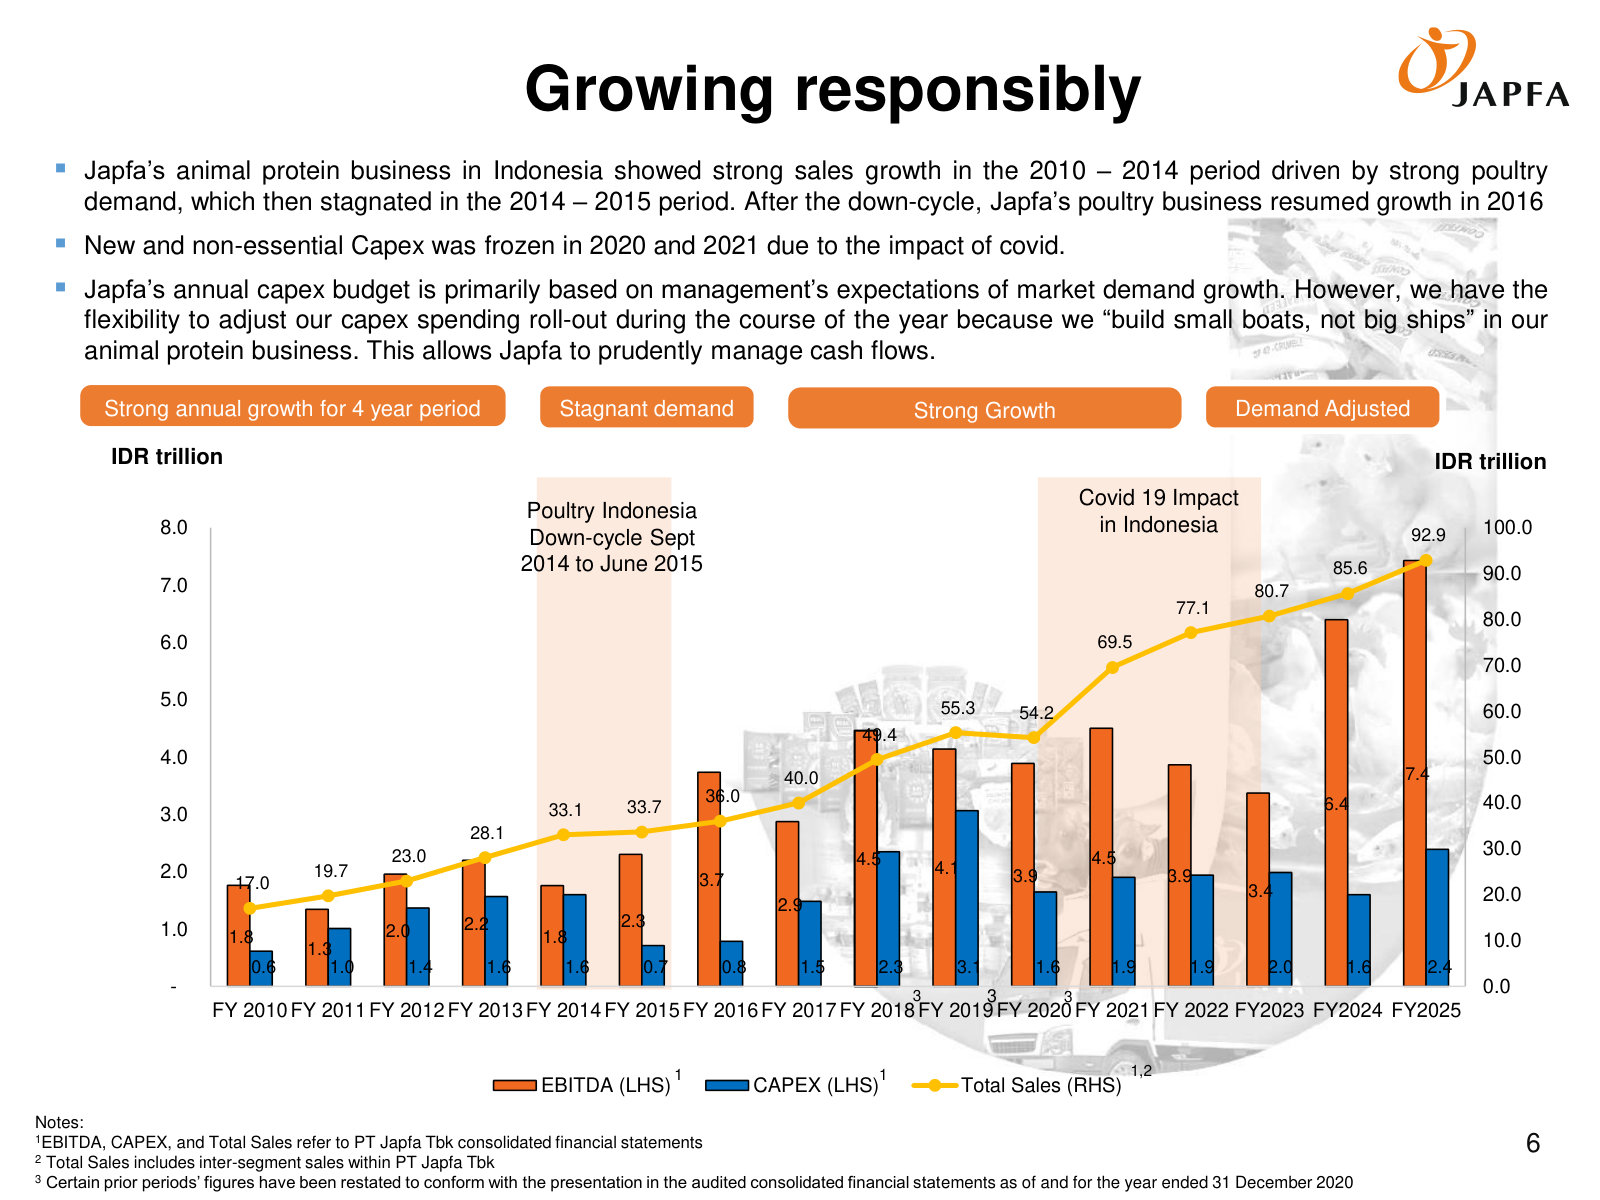
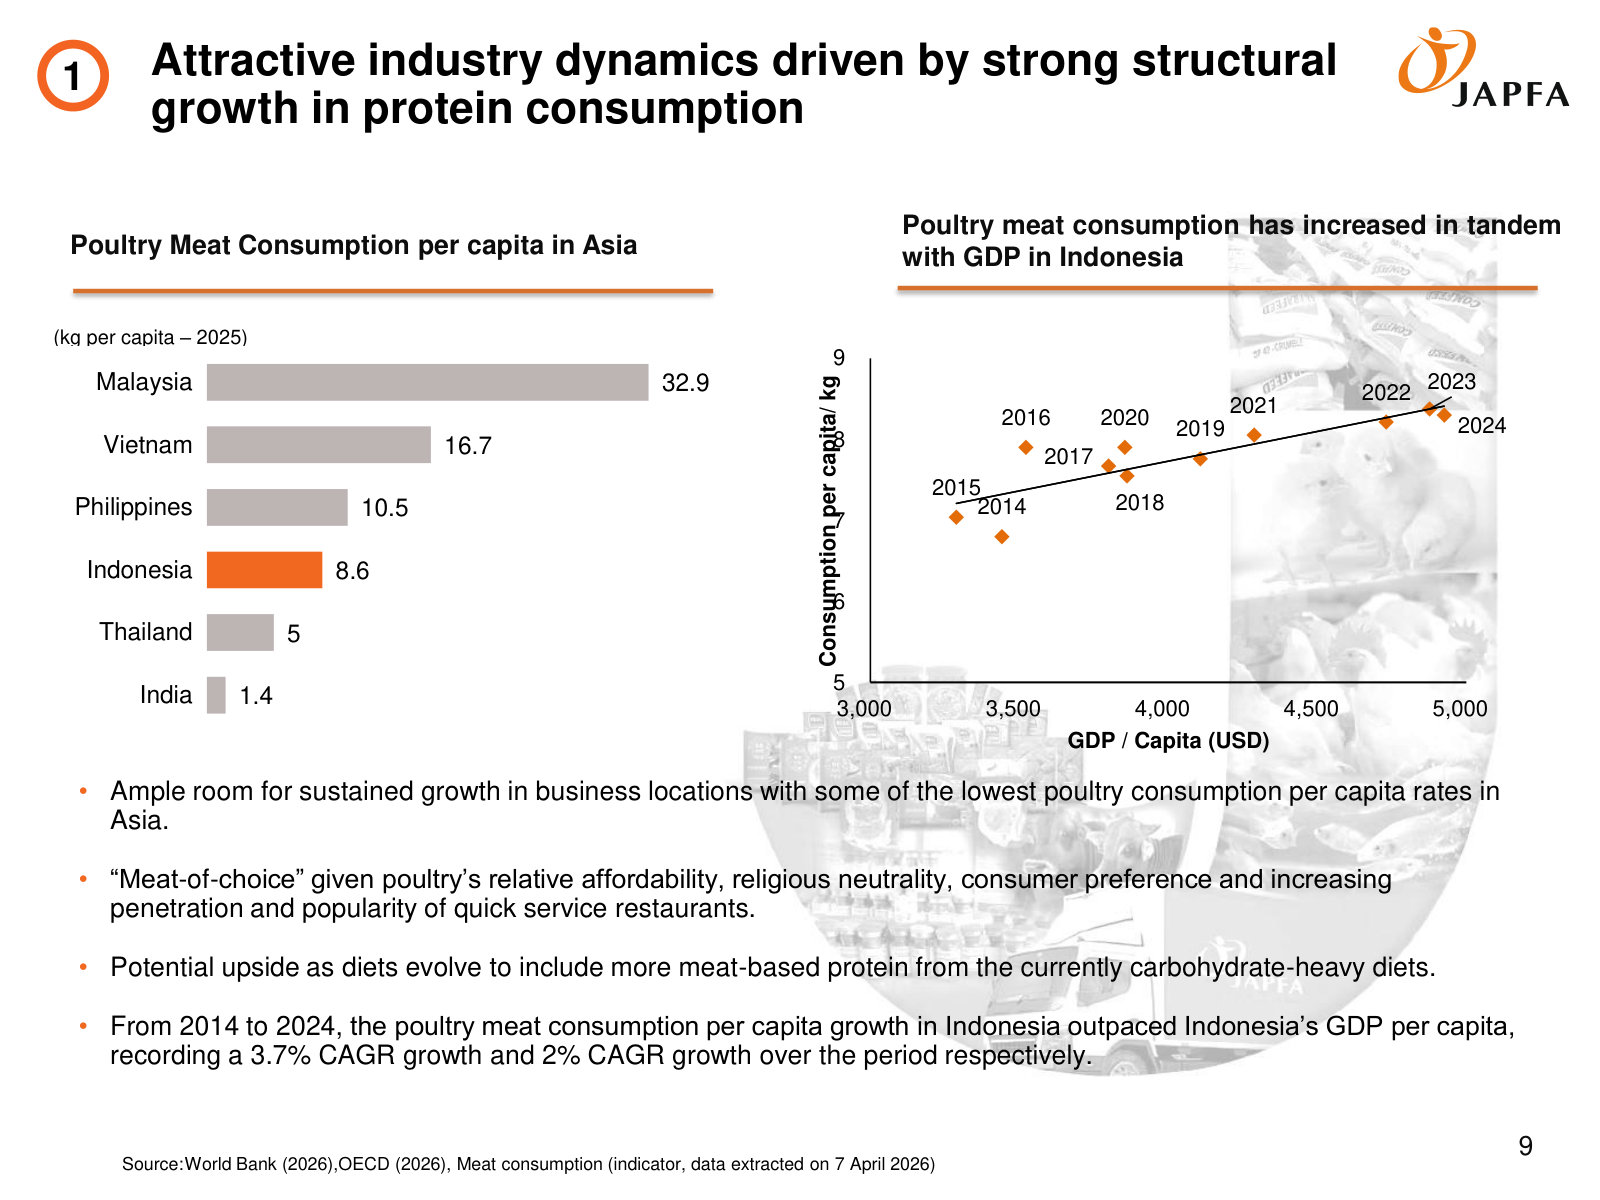
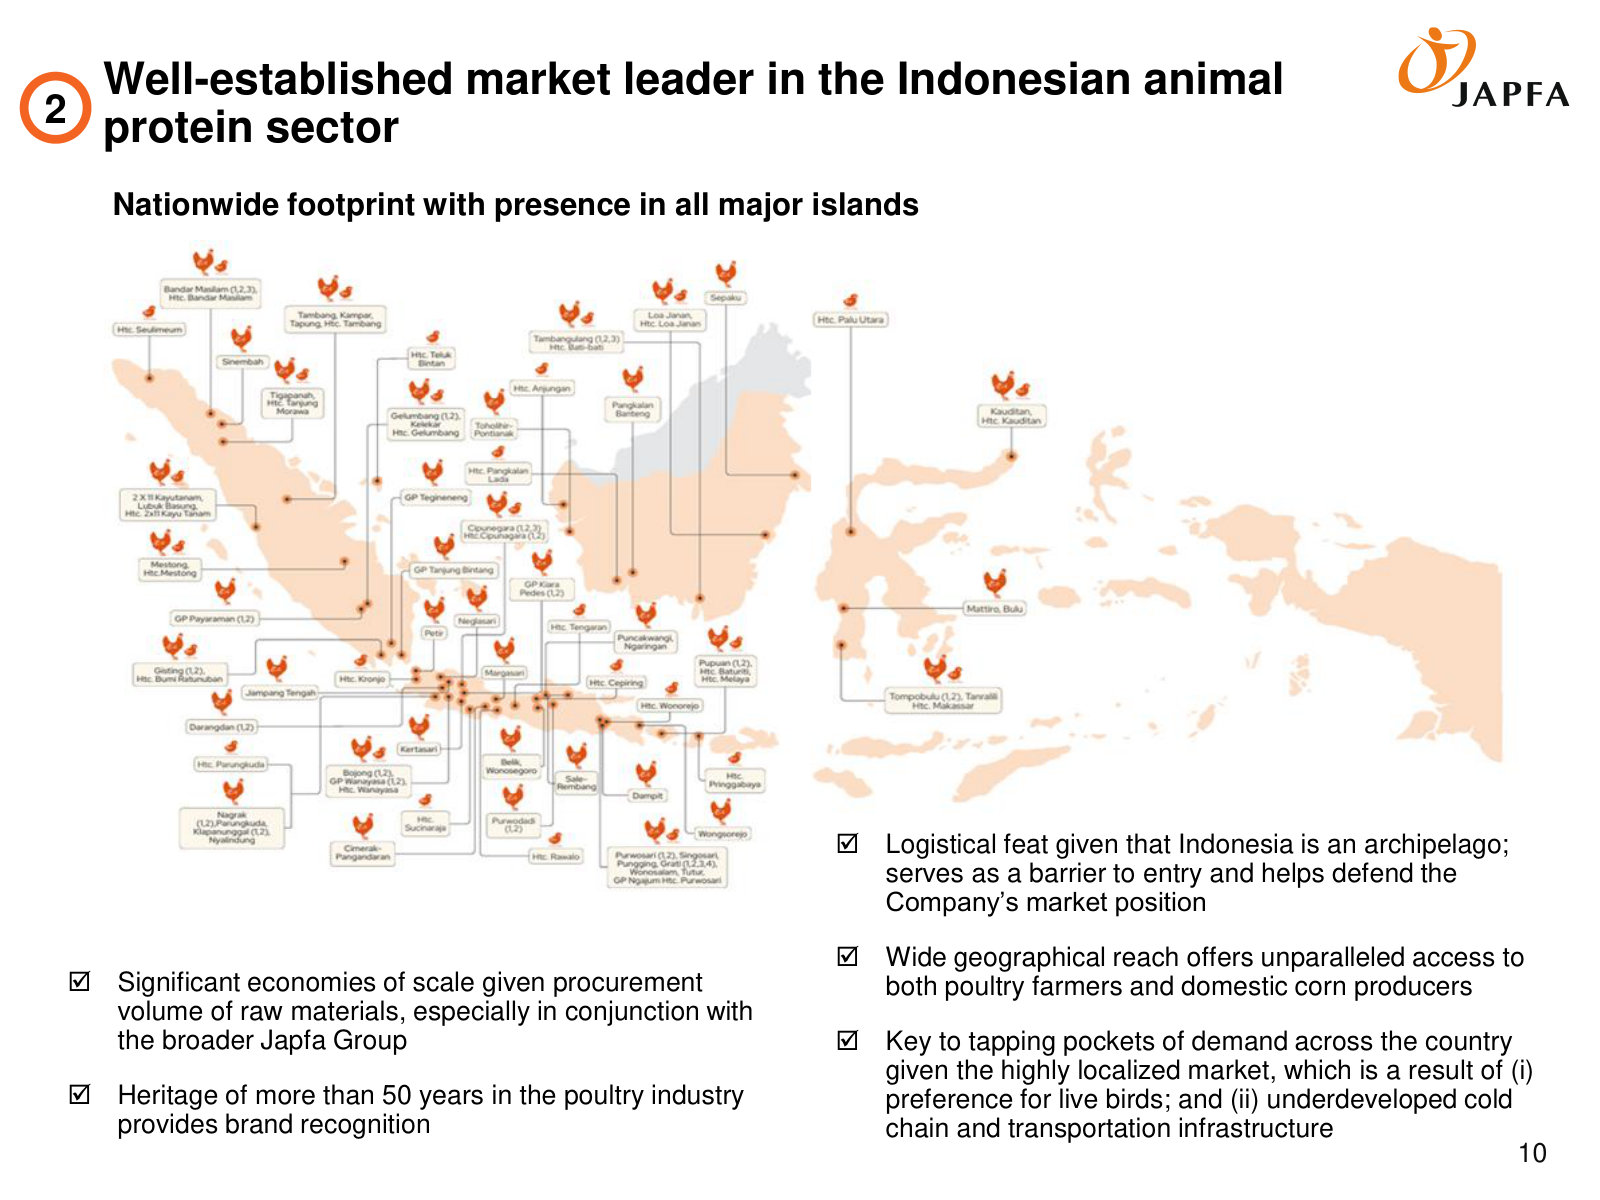
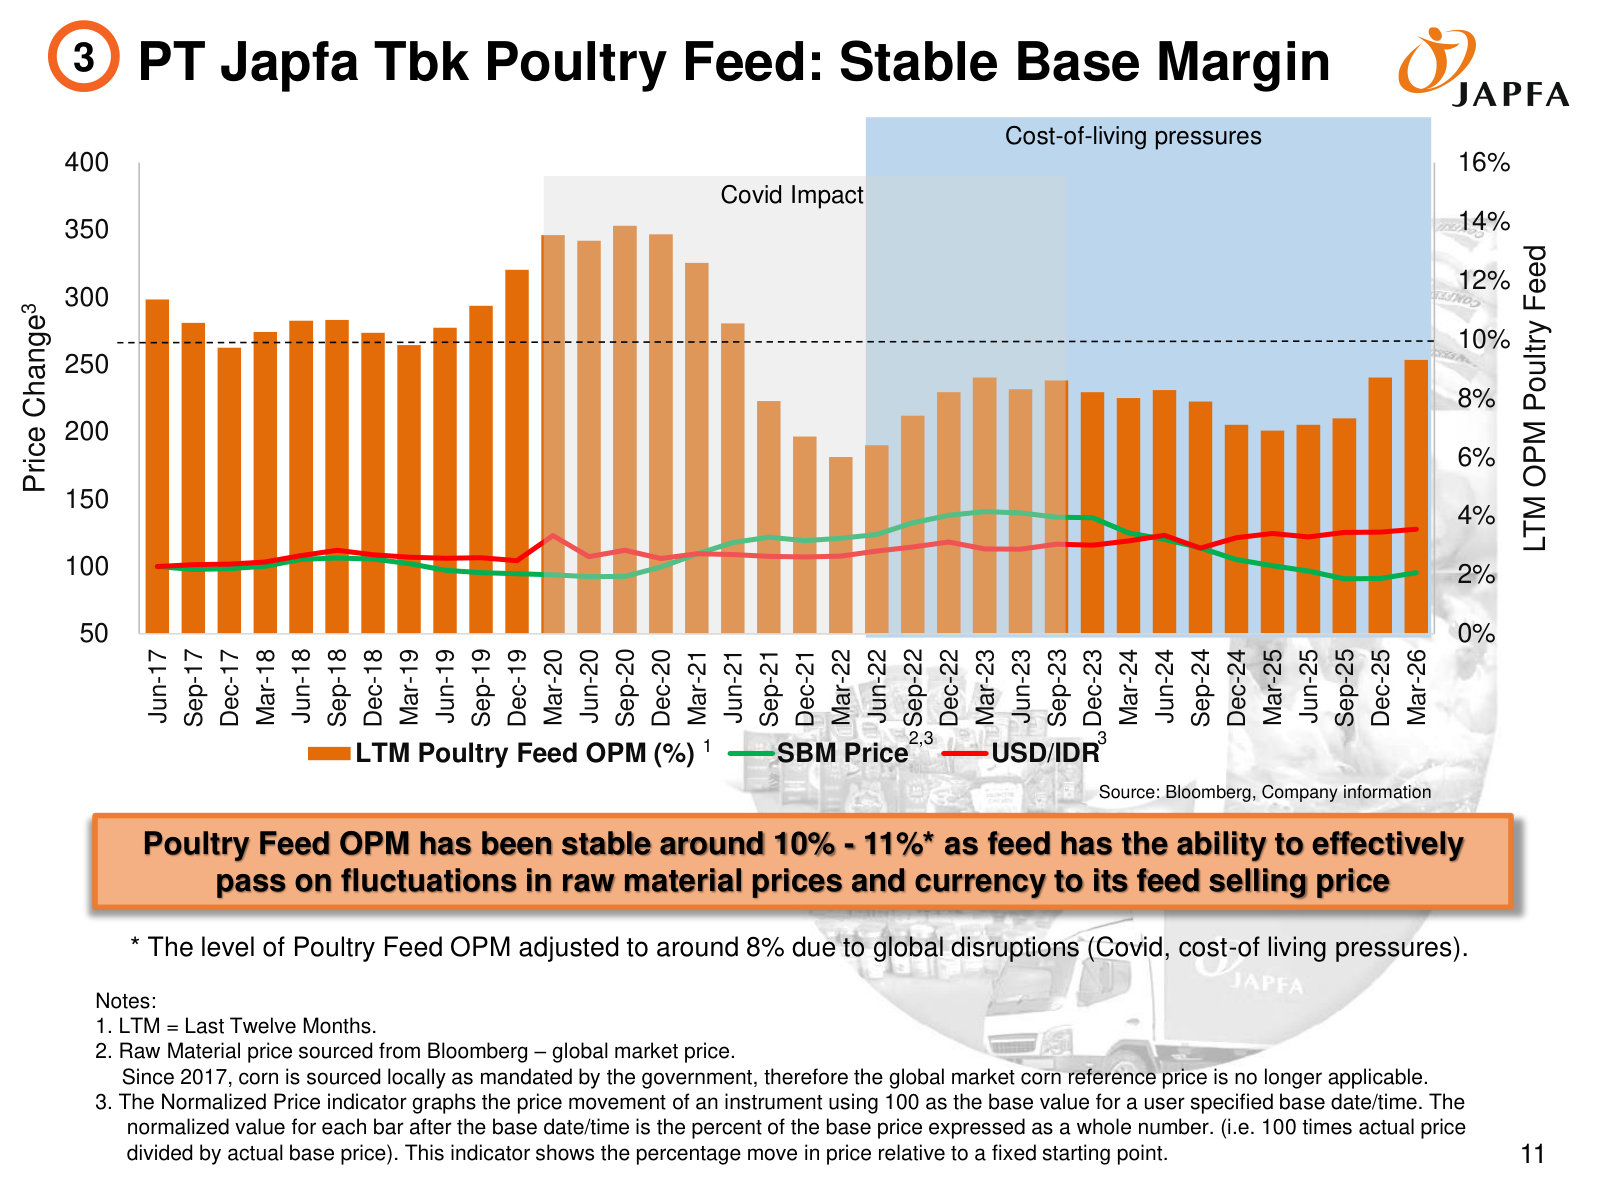
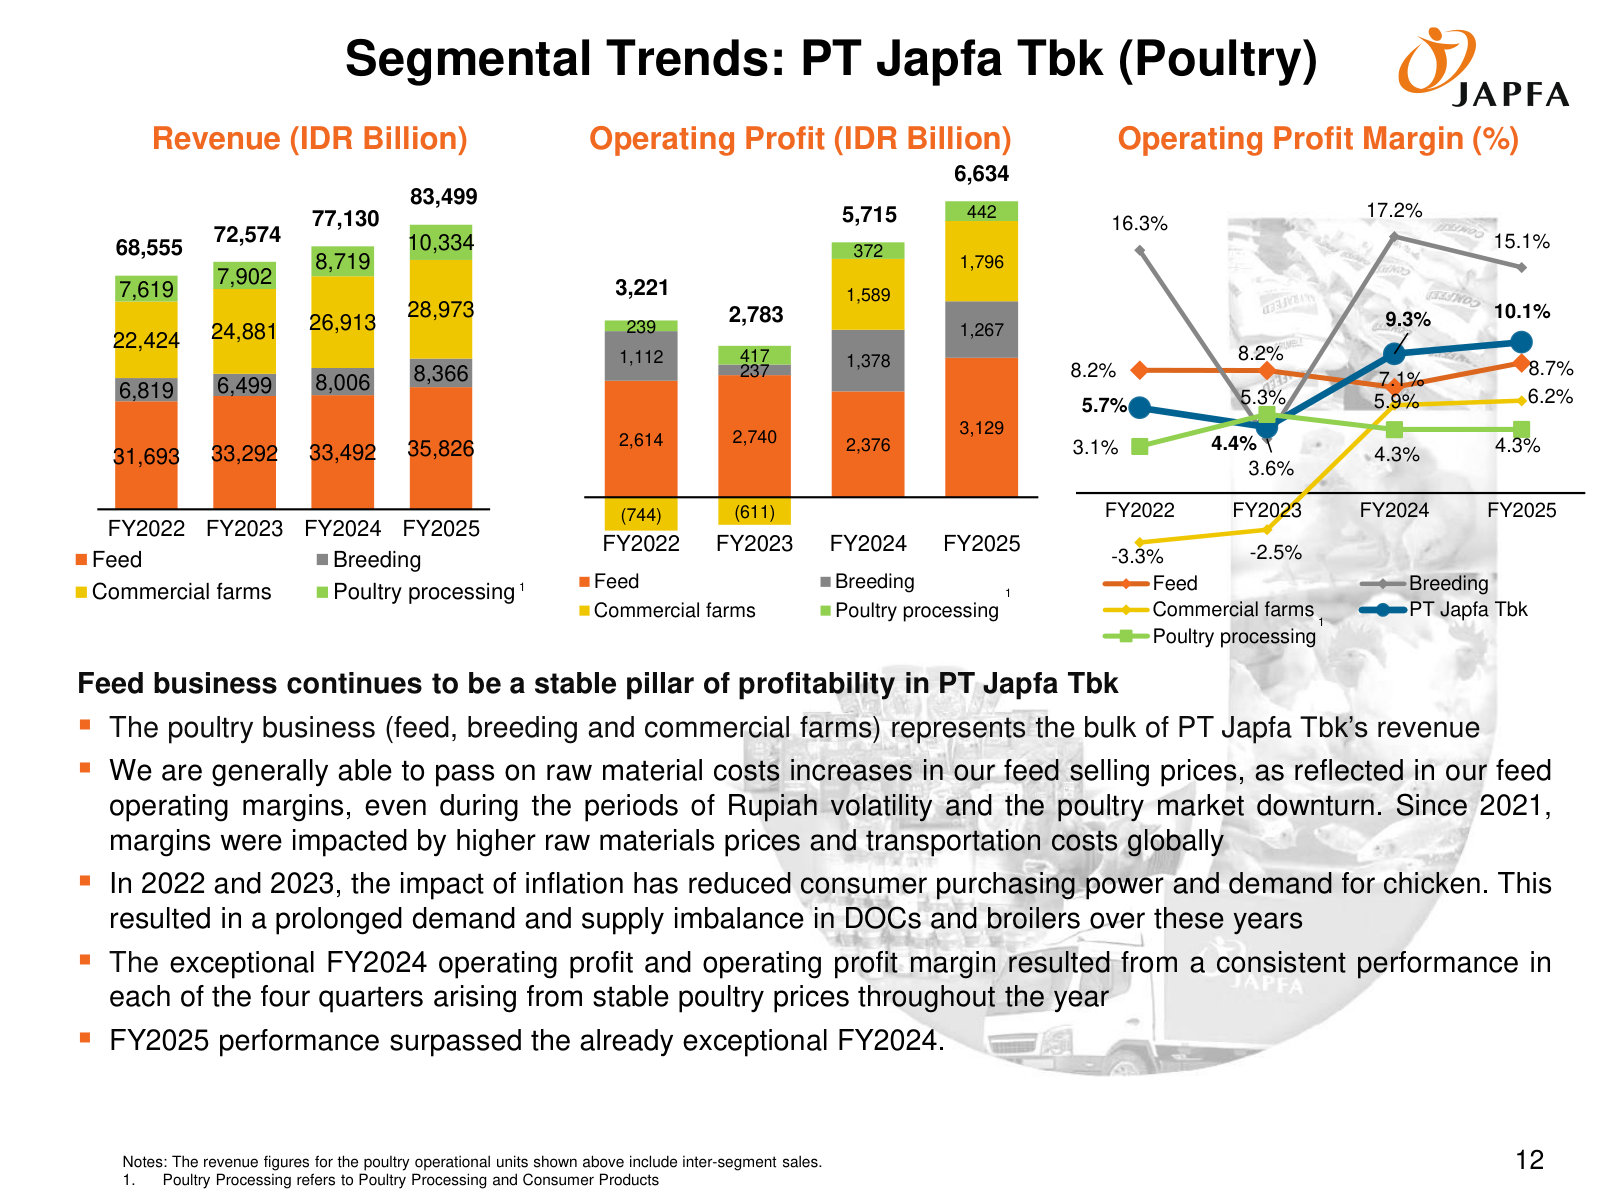
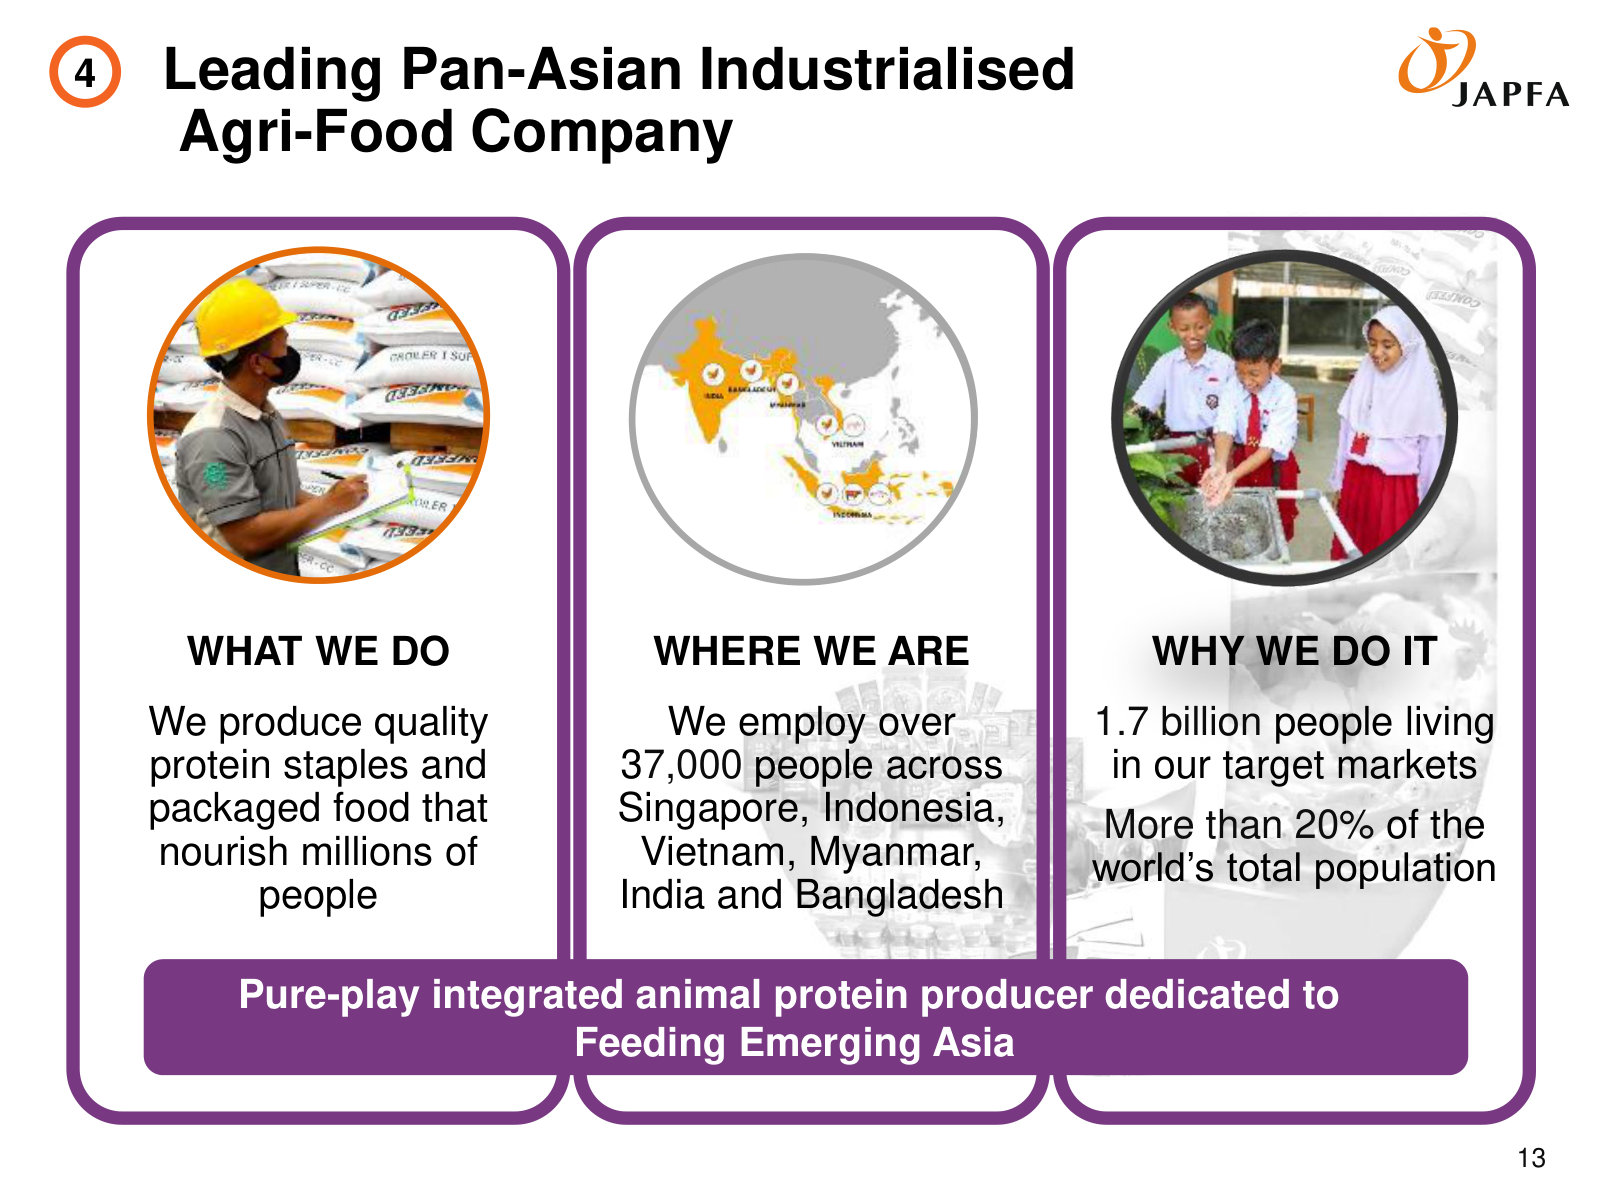
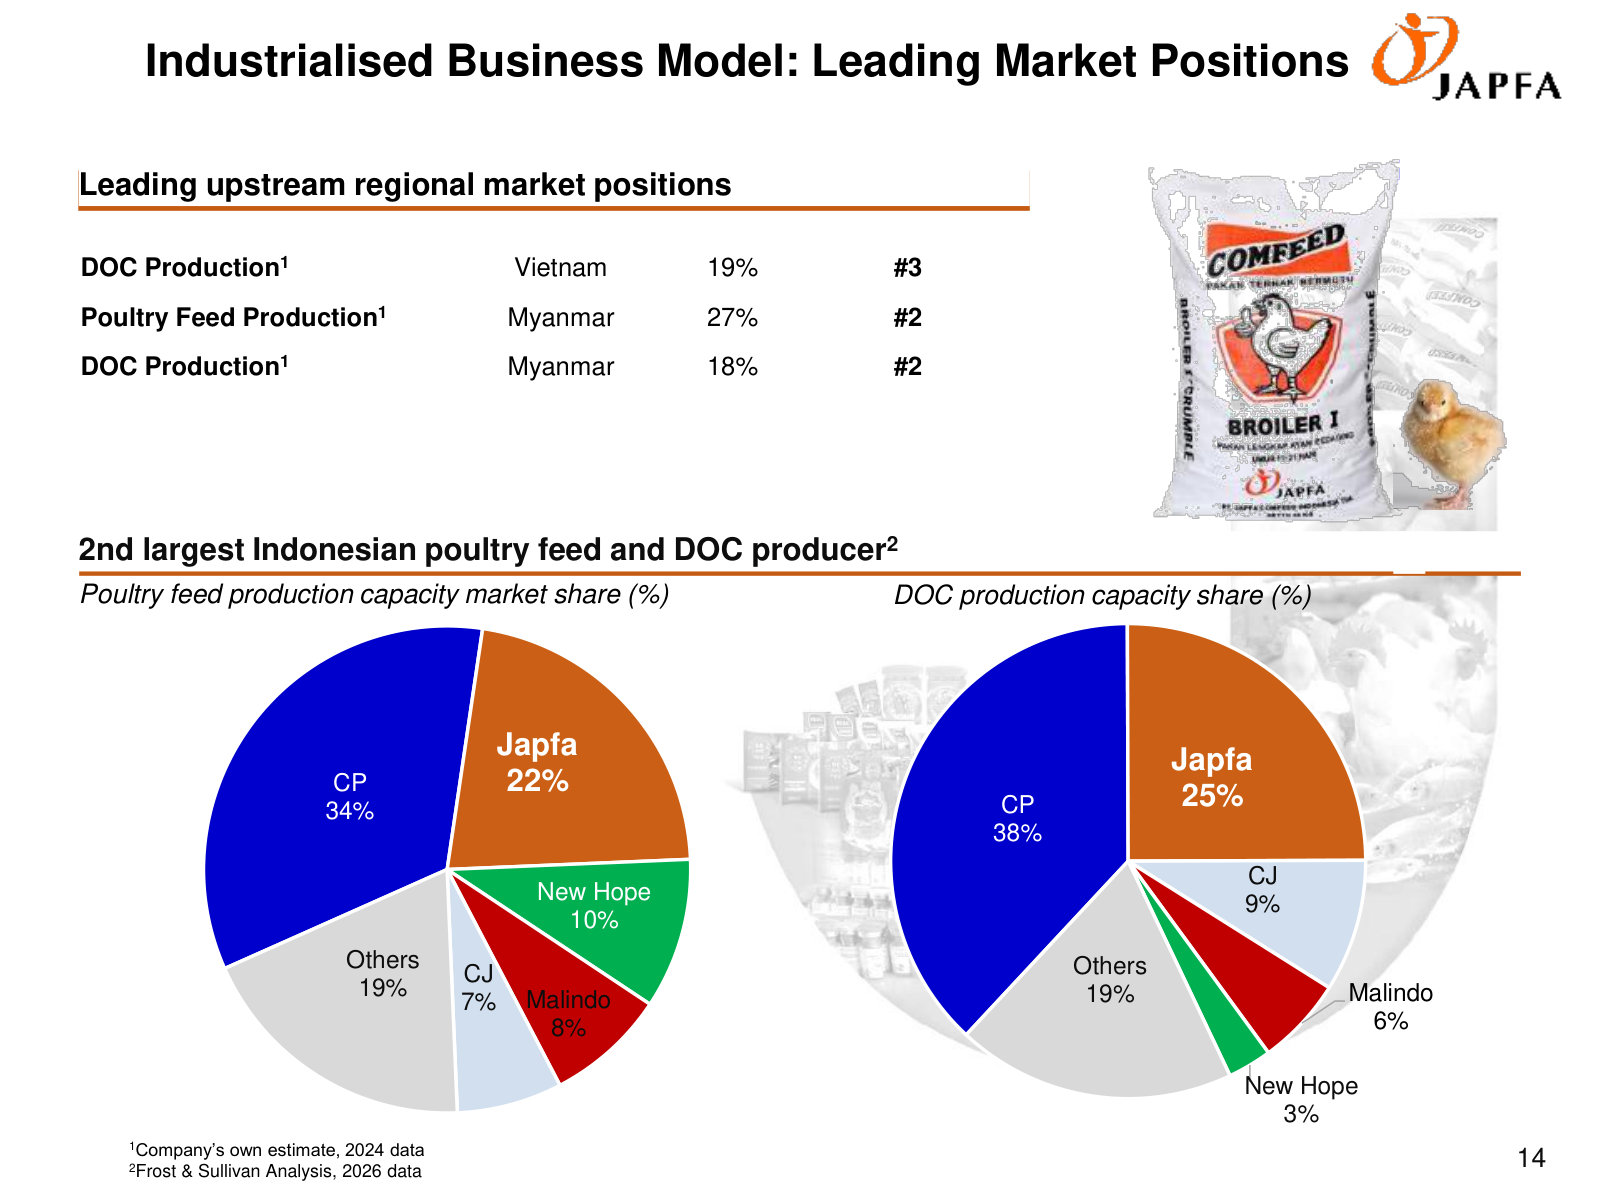
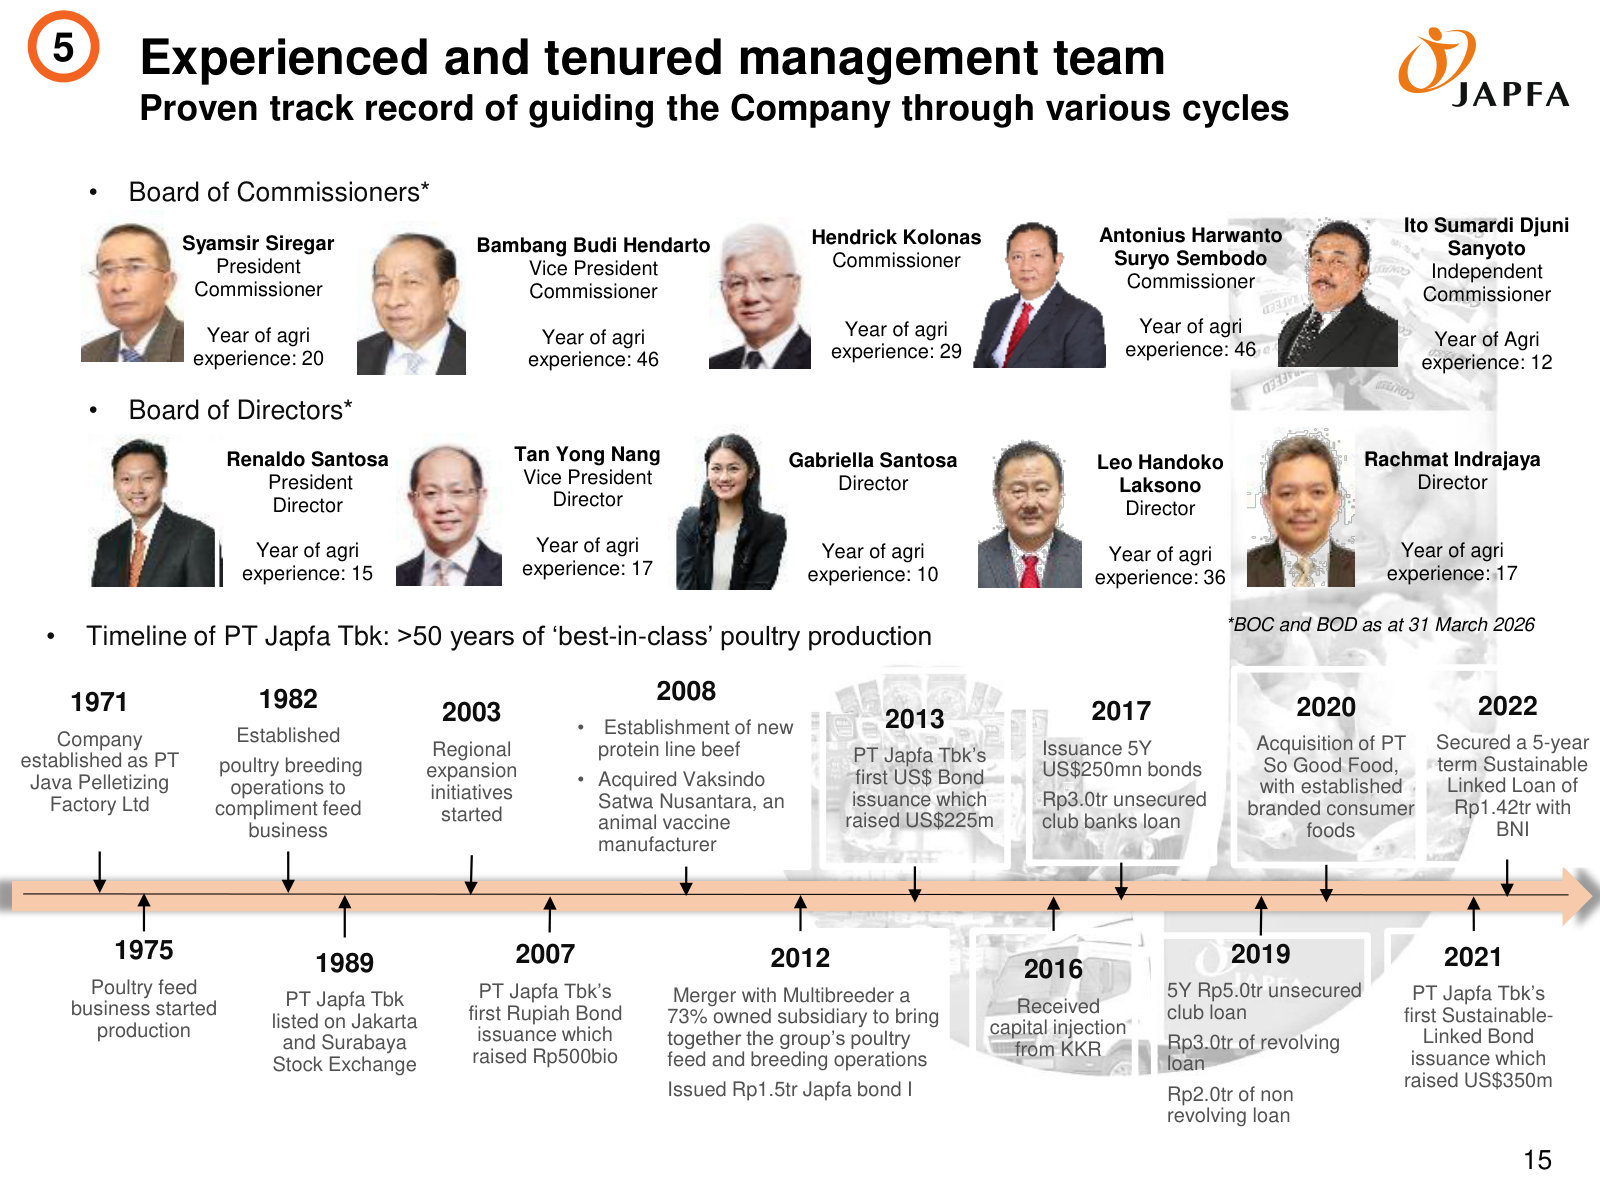
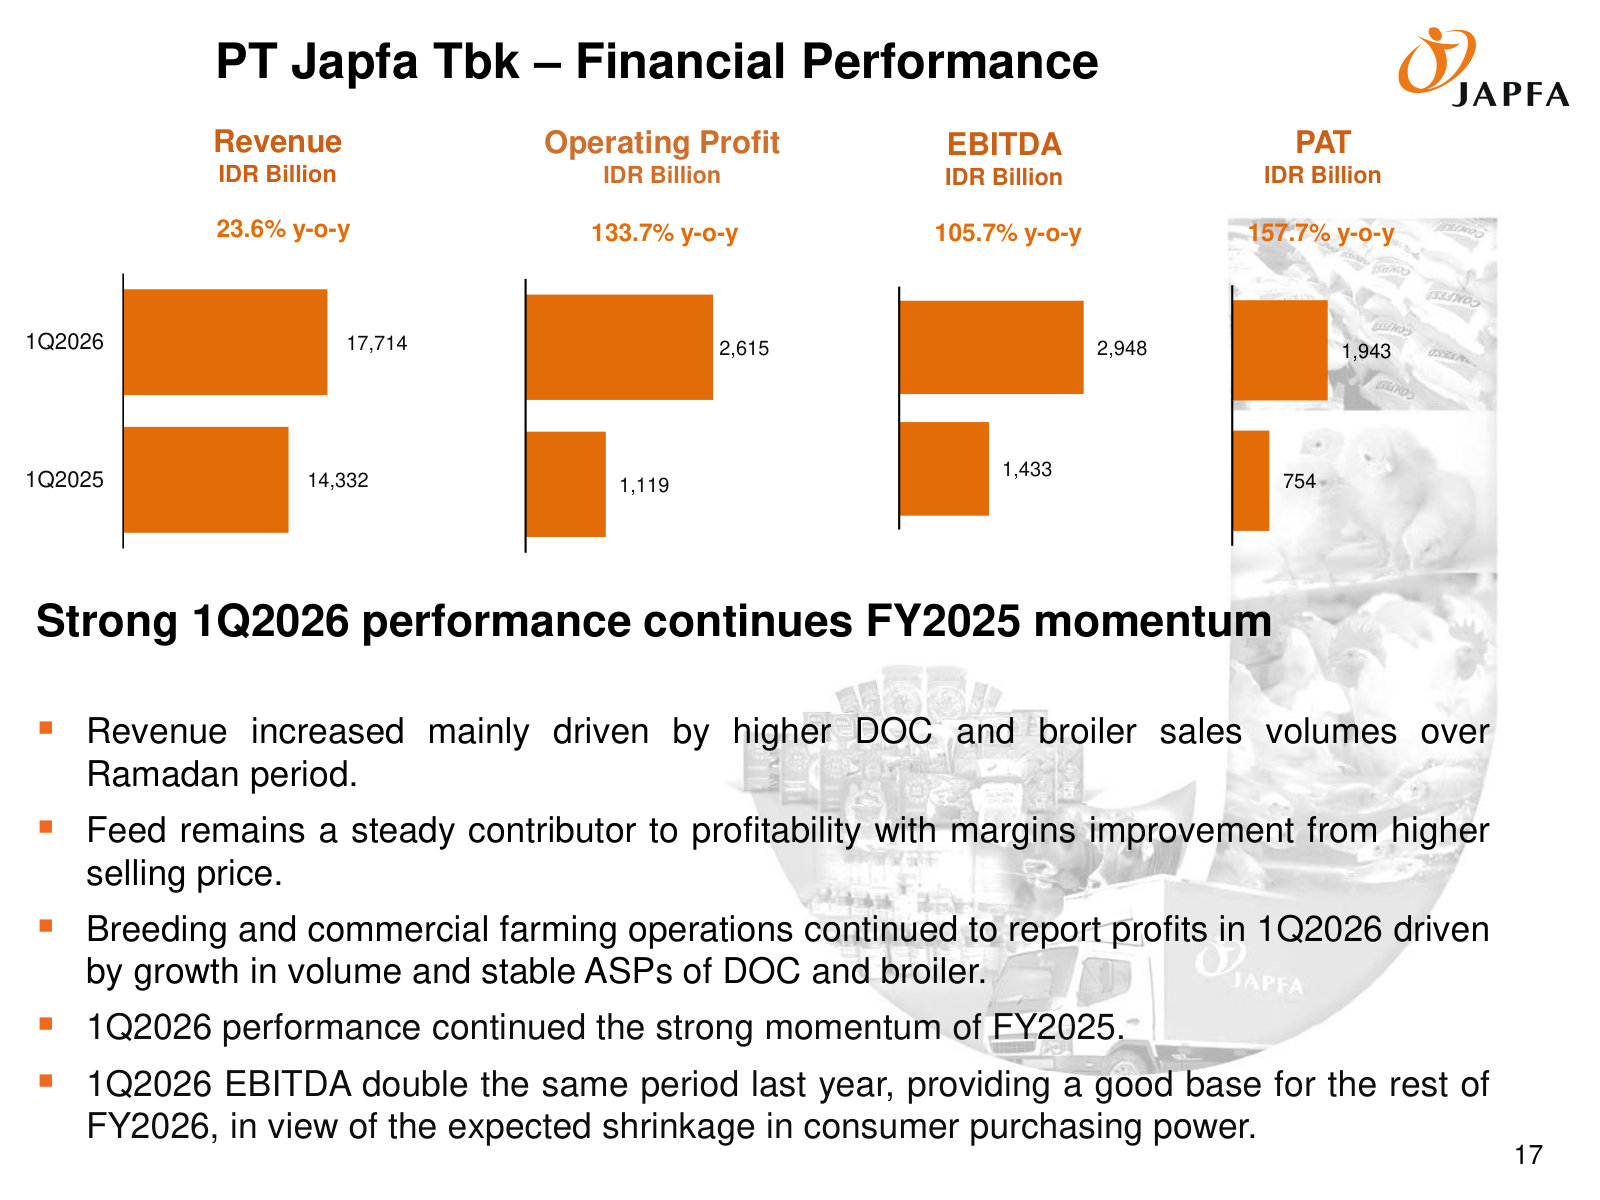
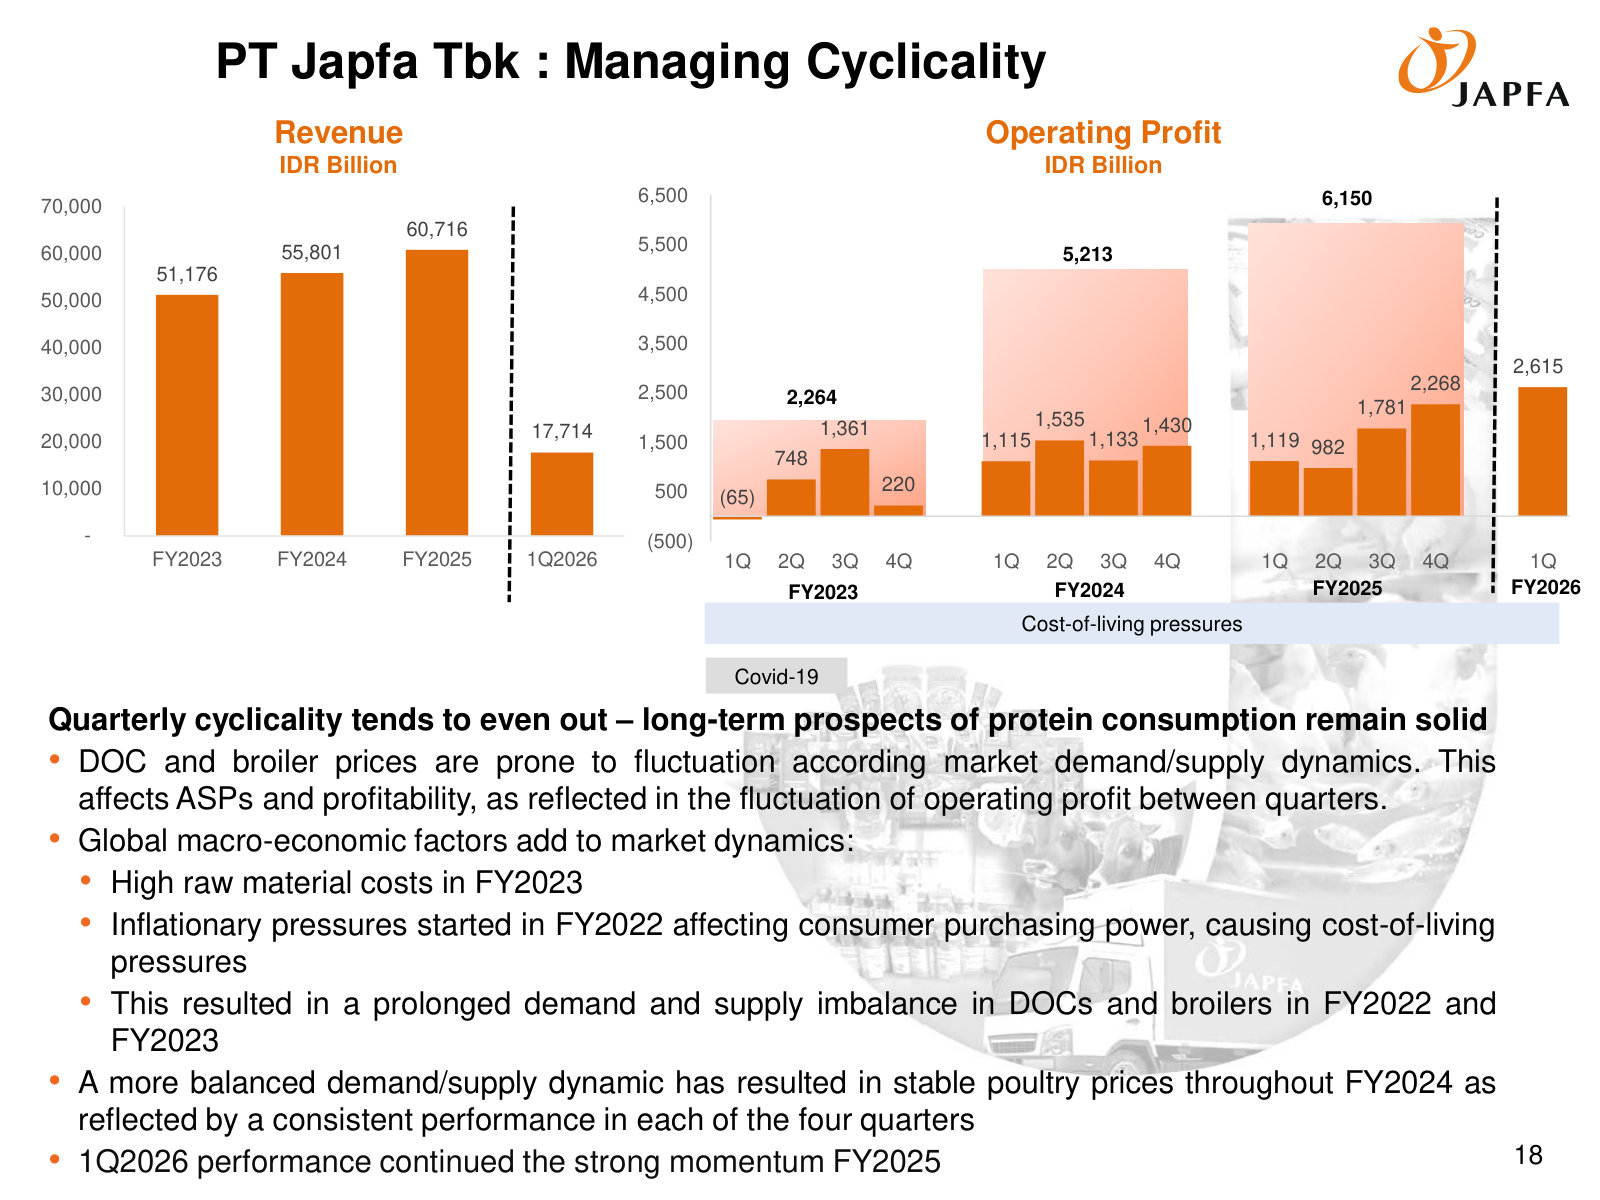
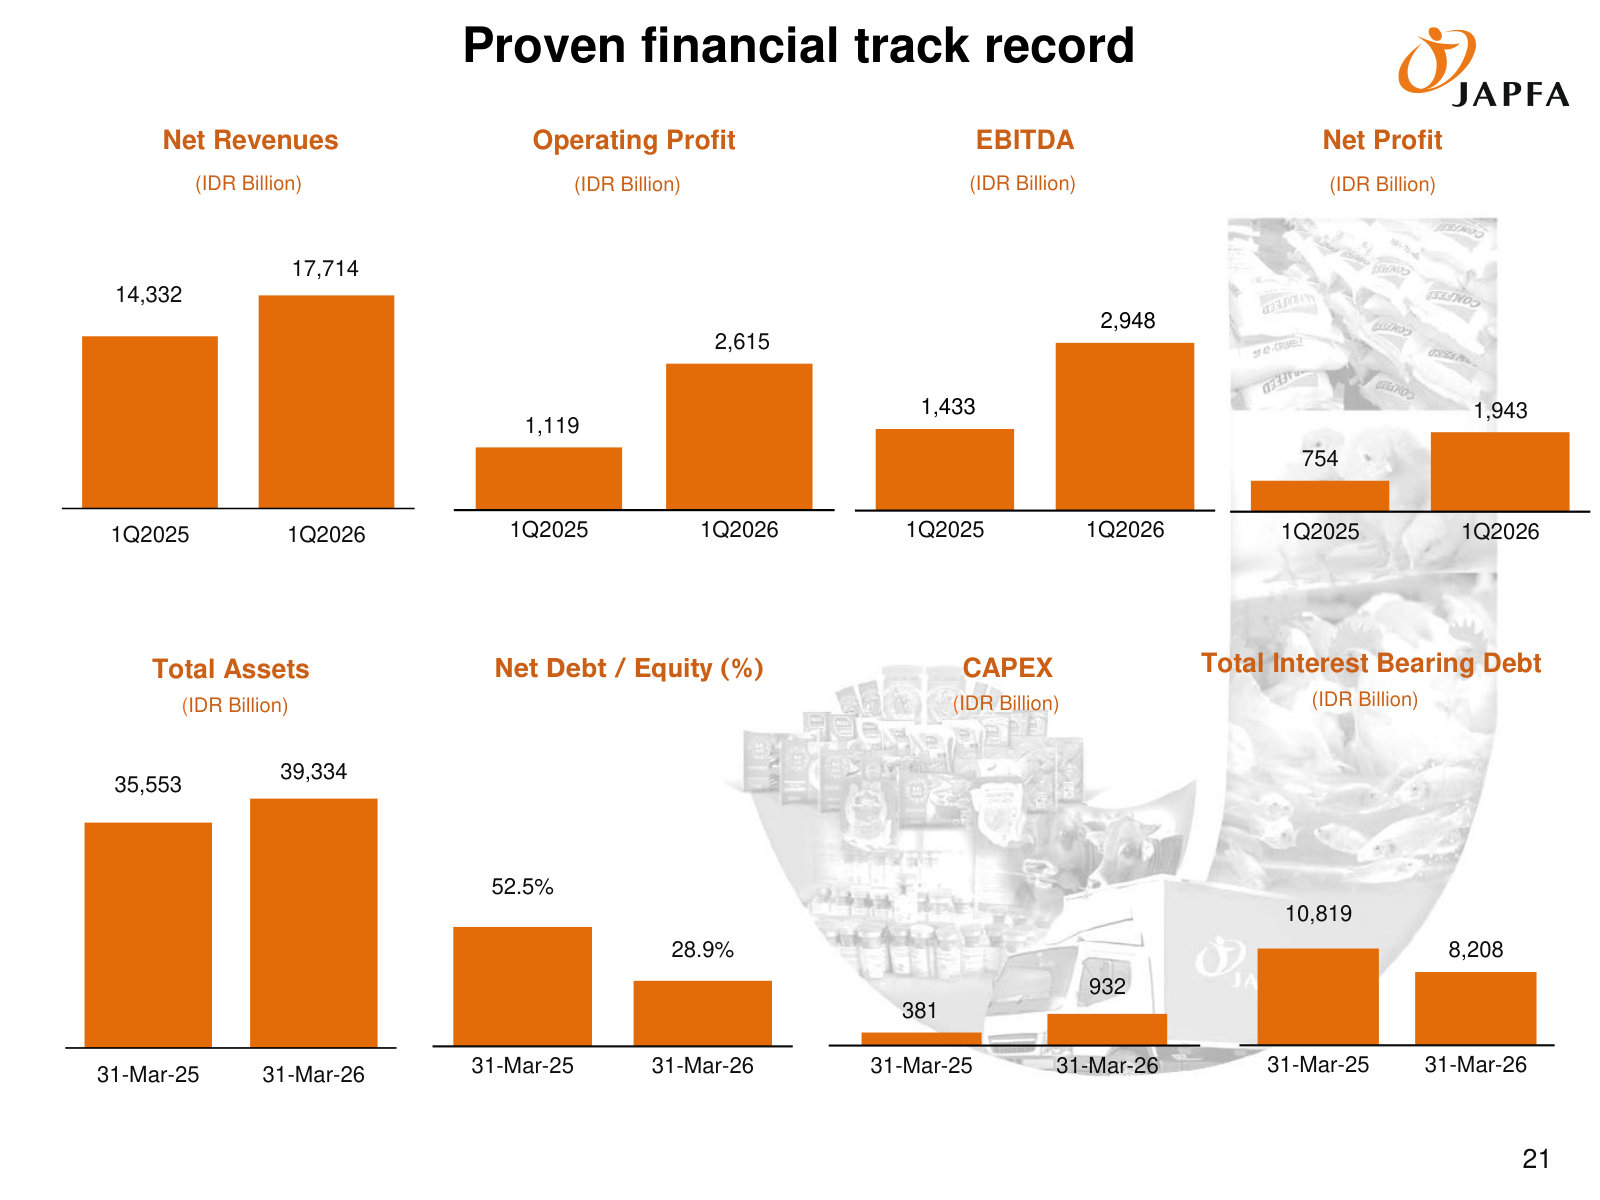
p. 4 — The whole business on one page: a vertically integrated chain — feed, breeding, farming, processing, brands — across poultry, aqua and beef. · Open the full presentation →p. 5 — Why scale matters: #2 feed and day-old-chick producer in Indonesia, with the technology, biosecurity and standardization that come with it. · Open the full presentation →p. 6 — Revenue by segment — poultry feed 39%, commercial farming 31%, processing/consumer 11% — with poultry ~90% of the FY2025 IDR 92.9tn total. · Open the full presentation →p. 7 — The 2010–2025 trajectory of EBITDA, capex and total sales, annotated with the down-cycles and Covid — the shape of a cyclical grower. · Open the full presentation →p. 10 — The demand runway: Indonesian poultry consumption (8.6 kg/capita) trails regional peers and tracks GDP — the structural growth case. · Open the full presentation →p. 11 — Nationwide footprint across the archipelago — the logistics reach that is itself a barrier to entry in a fragmented, localized market. · Open the full presentation →p. 12 — Unit economics of the core: poultry feed margin holds near 10–11% because feed passes raw-material and FX moves into selling price. · Open the full presentation →p. 13 — Segment profit detail: revenue, operating profit and margin by poultry sub-segment (feed, breeding, farming, processing), FY2022–FY2025. · Open the full presentation →p. 14 — The broader Japfa group context — a pan-Asian agri-food producer spanning six countries and 37,000 employees; Indonesia is the listed piece. · Open the full presentation →p. 15 — Competitive structure: Japfa holds ~22% of feed and ~25% of DOC capacity, second to CP, plus upstream positions in Vietnam and Myanmar. · Open the full presentation →p. 16 — Board and directors with a 1971–2022 milestone timeline — the 1989 listing, the 2016 KKR capital injection, bonds and acquisitions. · Open the full presentation →p. 18 — Latest quarter: 1Q2026 revenue, operating profit, EBITDA and PAT all up sharply year-on-year, with the demand and margin drivers. · Open the full presentation →p. 19 — Managing cyclicality: quarterly revenue and operating profit FY2023–1Q2026, showing how volatile DOC/broiler prices even out over a year. · Open the full presentation →p. 22 — Financial-health snapshot: revenue, profit, assets, capex and debt — with net debt/equity down to 28.9%, the balance-sheet view. · Open the full presentation →
Investor Presentation FY2025 — FY2025 · 23 pages · The full-year FY2025 results — record EBITDA — in the same template, for annual segment and financial detail behind the 1Q2026 update. · Open →
Investor Presentation FY2024 — FY2024 · 24 pages · The exceptional FY2024 baseline year that management now benchmarks recent performance against. · Open →
Investor Presentation FY2023 — FY2023 · 27 pages · The FY2023 down-cycle deck — inflation and weak chicken demand — showing how the business presents a trough year. · Open →
Investor Presentation 2Q 2016 — 2Q2016 · 26 pages · How the company framed itself in the KKR-investment era, a decade before the recent up-cycle. · Open →